
-
摘要: 采用实验设计田口法及响应面法,对镍基高温合金选择性激光熔化过程中的三个工艺参数(激光功率、扫描速度和扫描间距)进行优化,以成形样品的相对密度作为评价标准,研究工艺参数对最终试样相对密度的影响。基于方差分析、信噪比、主效应图、响应曲线图等,分析各因素及其之间的相互作用对样品相对密度的影响。研究结果表明,不同工艺参数对试样相对密度的影响效果差别很大,其中扫描间距的影响效果最大,其次是激光功率和扫描速度,此外扫描速度与扫描间距的交互作用对于试样相对密度的影响也比较显著。两种不同优化方法获得的最佳工艺参数组合相同,均为激光功率280 W、扫描速度1000 mm·s−1以及扫描间距0.12 mm。Abstract: The experimental design Taguchi method and response surface methodology were used to optimize the process parameters of the selective laser melting for Ni-based superalloy (laser power, scanning speed and scanning spacing). The effect of the process parameters on the relative density of the final samples was determined by using the relative density as the evaluation standard. Based on the analysis of variance, signal-to-noise ratio, main effect diagram, and response curve, the effects of the process parameters and the parameter interactions on the relative density of samples were evaluated. In the results, the effects of the process parameters on the relative density of the final samples vary greatly, the scanning spacing shows the largest effect, followed by laser power and scanning speed. In addition, the interaction between scanning speed and scanning spacing is also significant for the effect on the sample relative density. The best process parameters obtained by two different optimization methods are the same as the laser power is 280 W, the scanning speed is 1000 mm·s−1, and the scanning spacing is 0.12 mm.
-
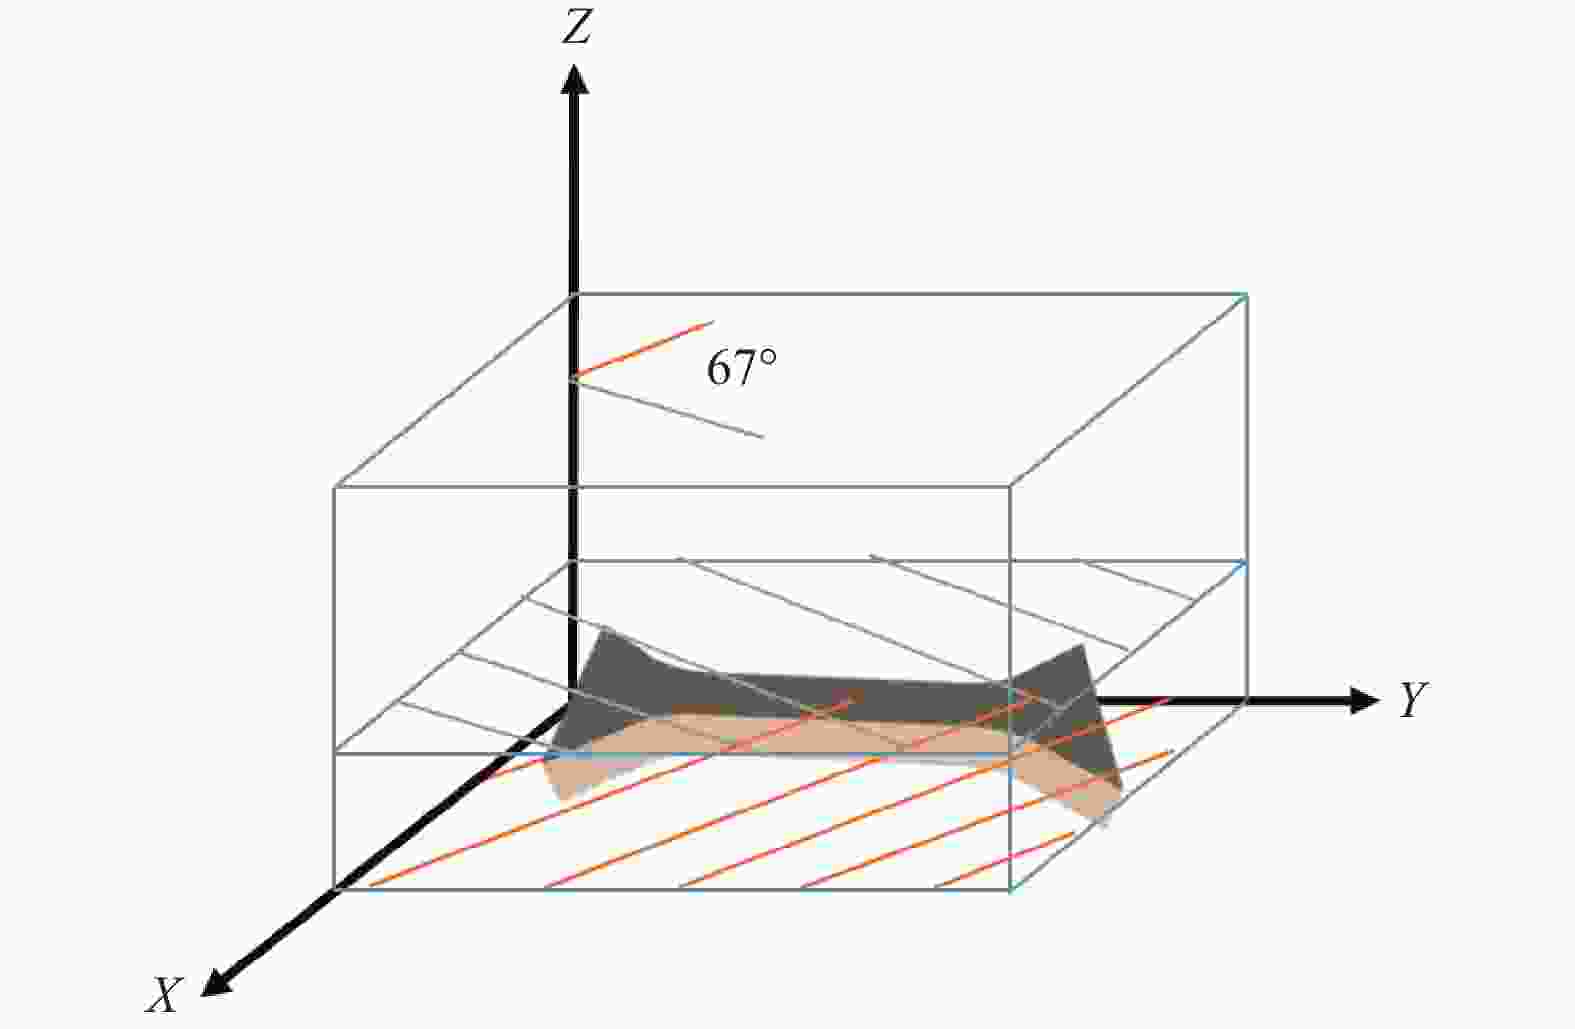
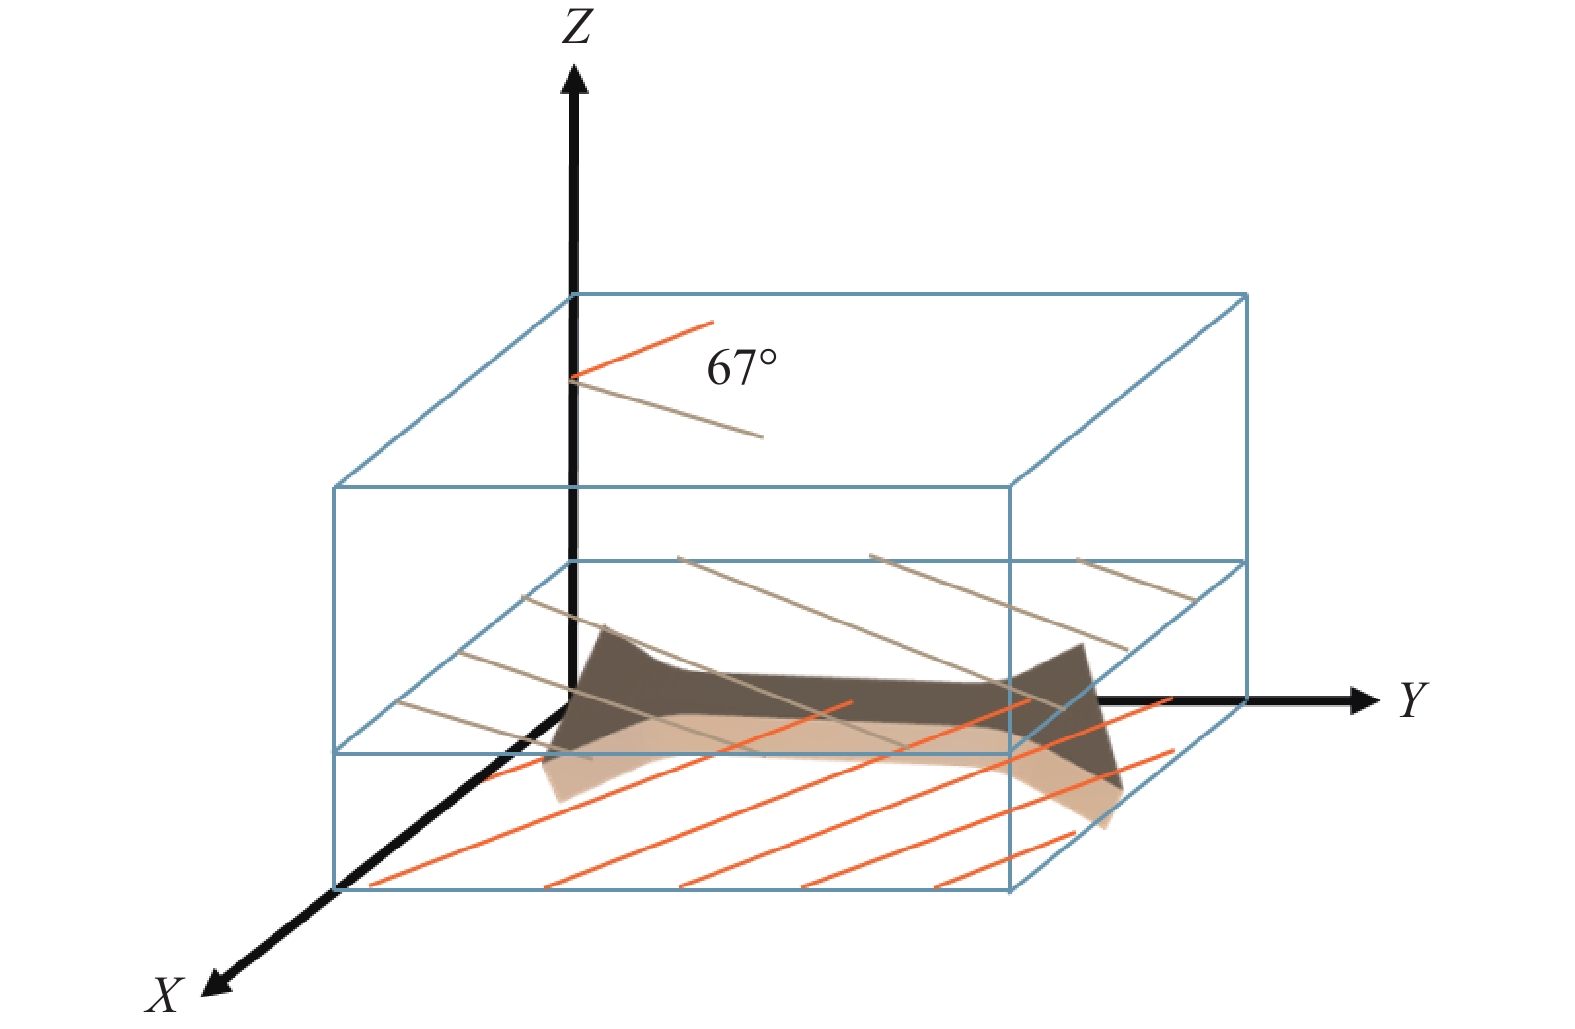
图 2 扫描策略在选择性激光熔化实验中的应用
Figure 2. Application of the scanning strategy in the selective laser melting experiment
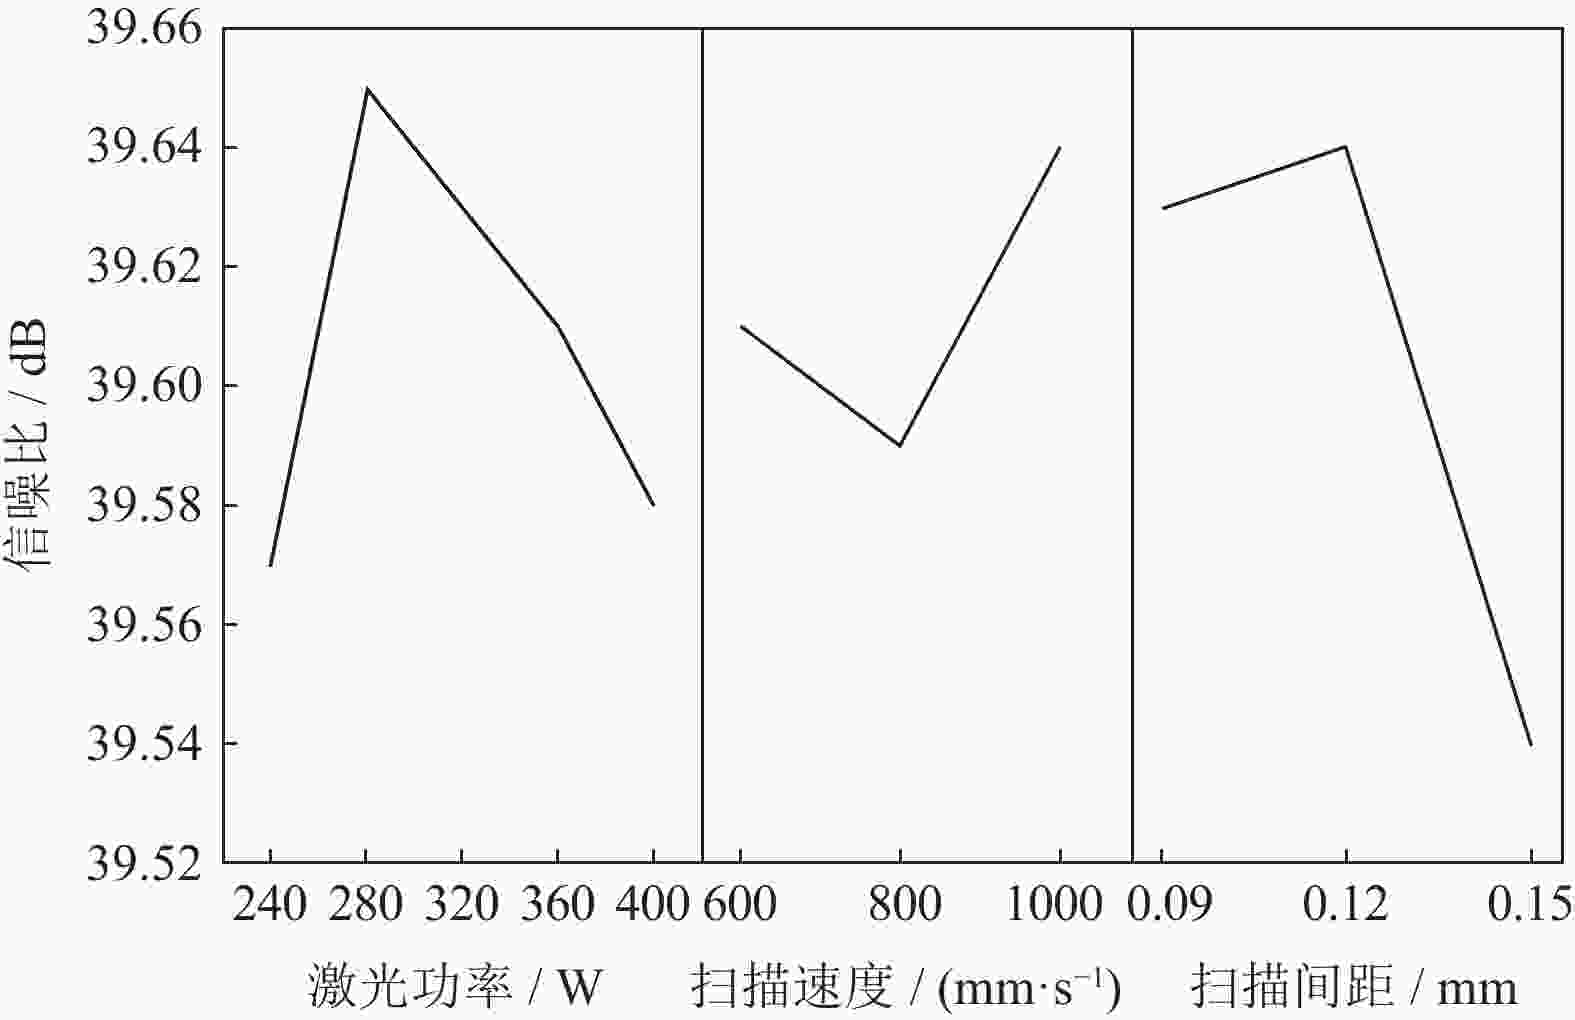
图 3 各因素的相对密度信噪比对比图
Figure 3. Signal-to-noise ratio of relative density for various factors
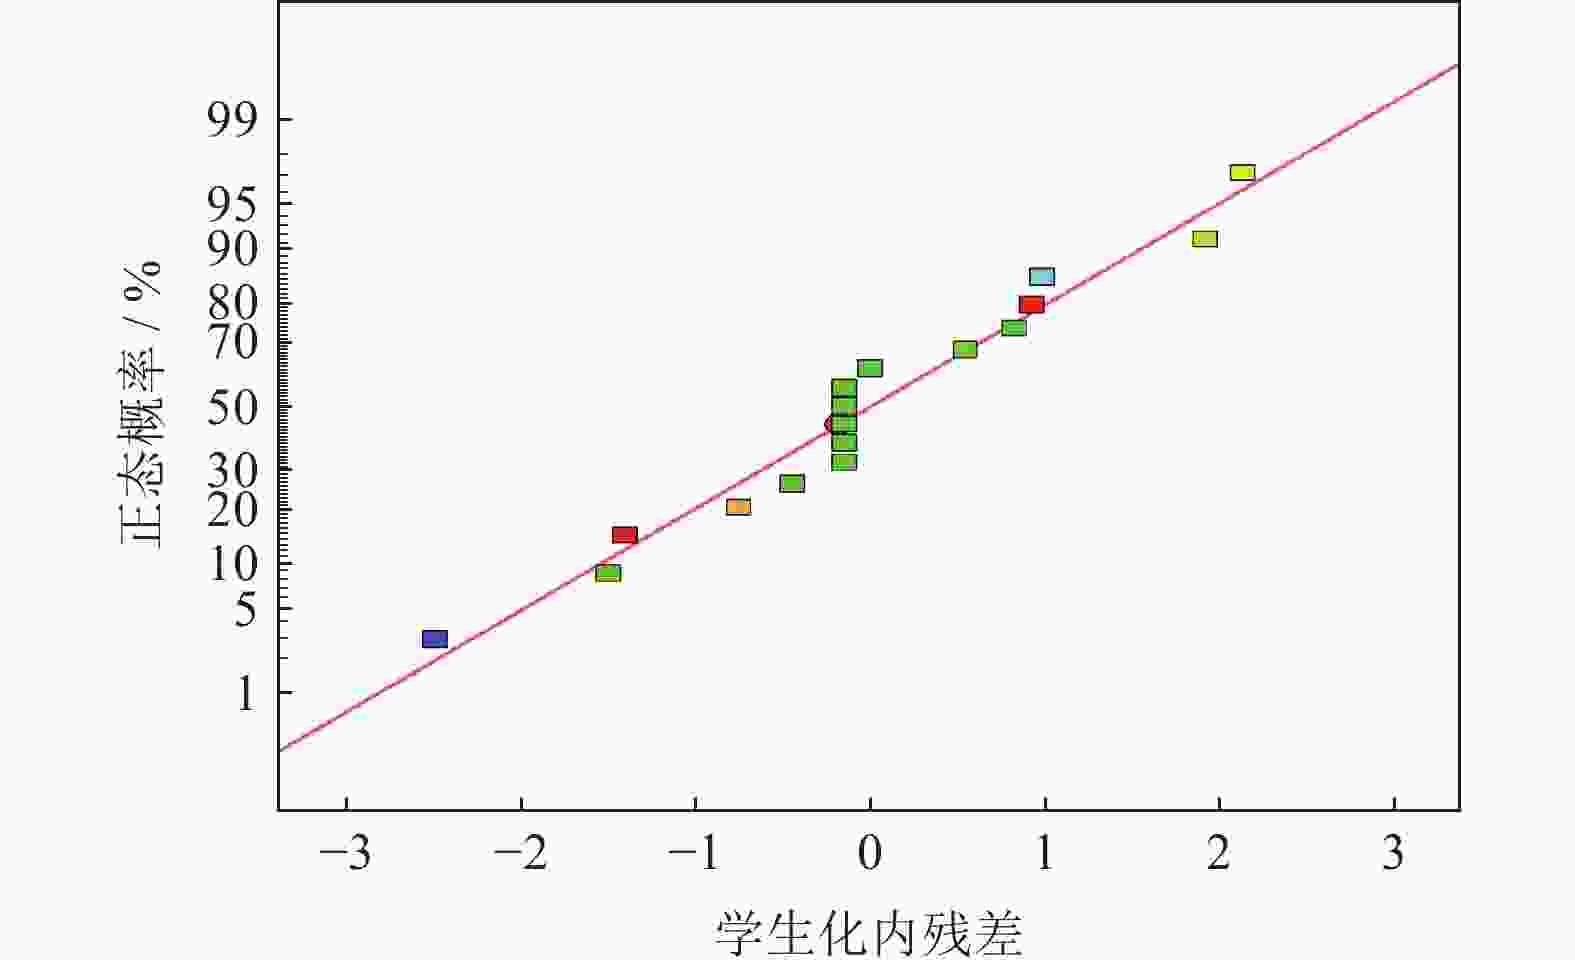
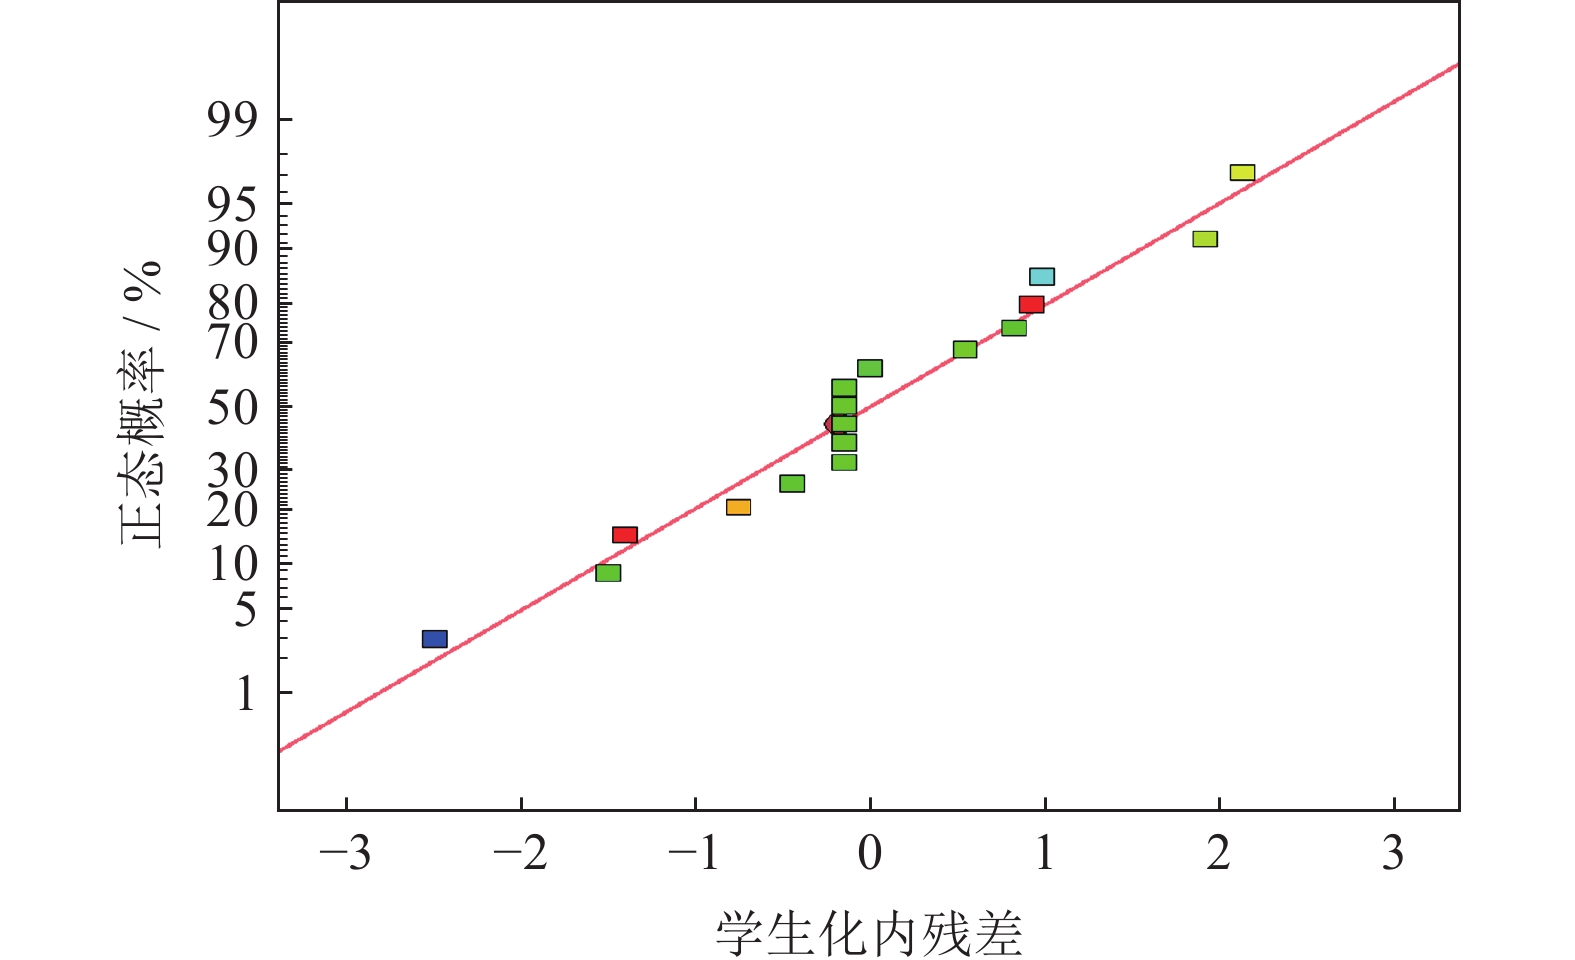
图 4 相对密度的残差正态概率分布图
Figure 4. Residual normal probability distribution of the relative density
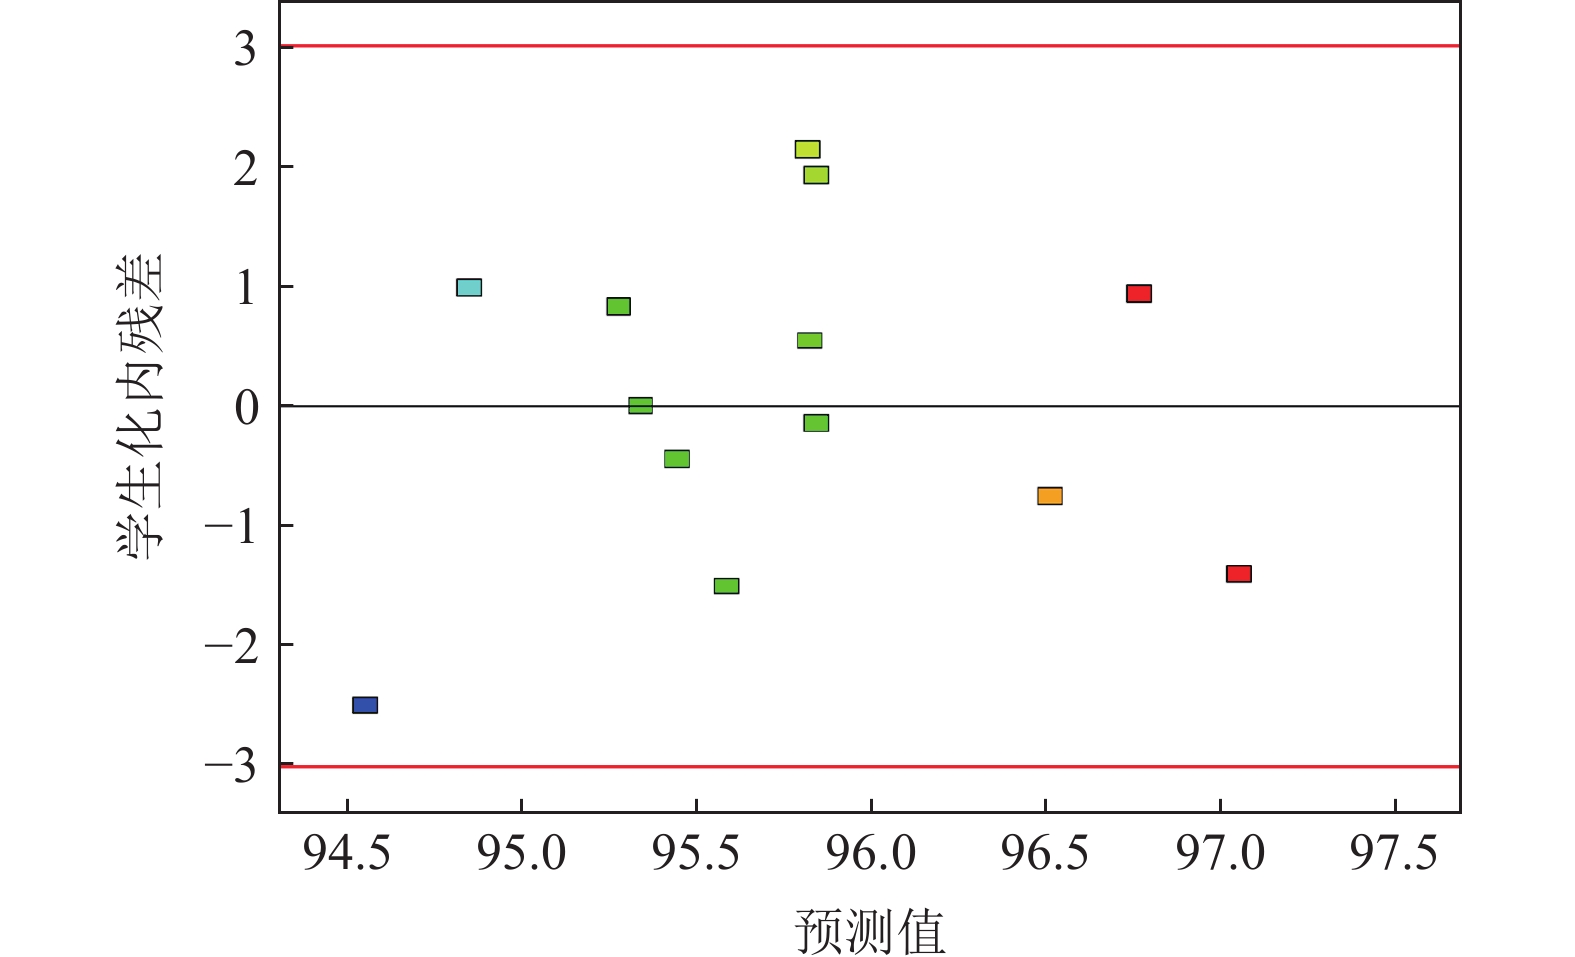
图 5 相对密度的残差与预测值分布图
Figure 5. Residual and predicted distribution of the relative density
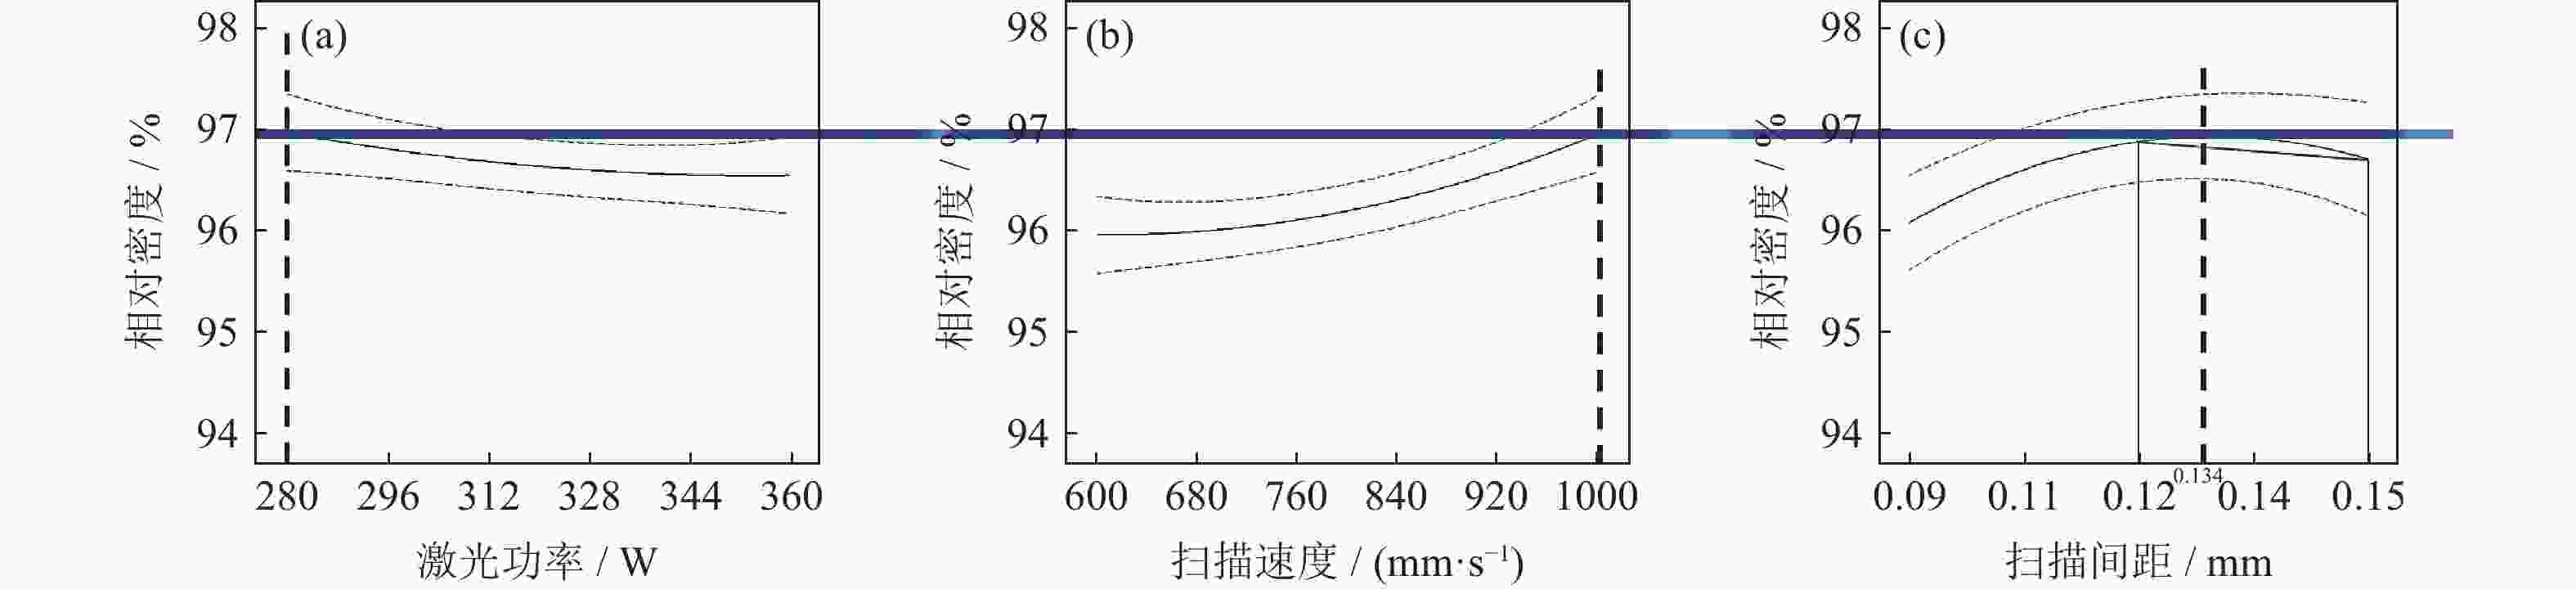
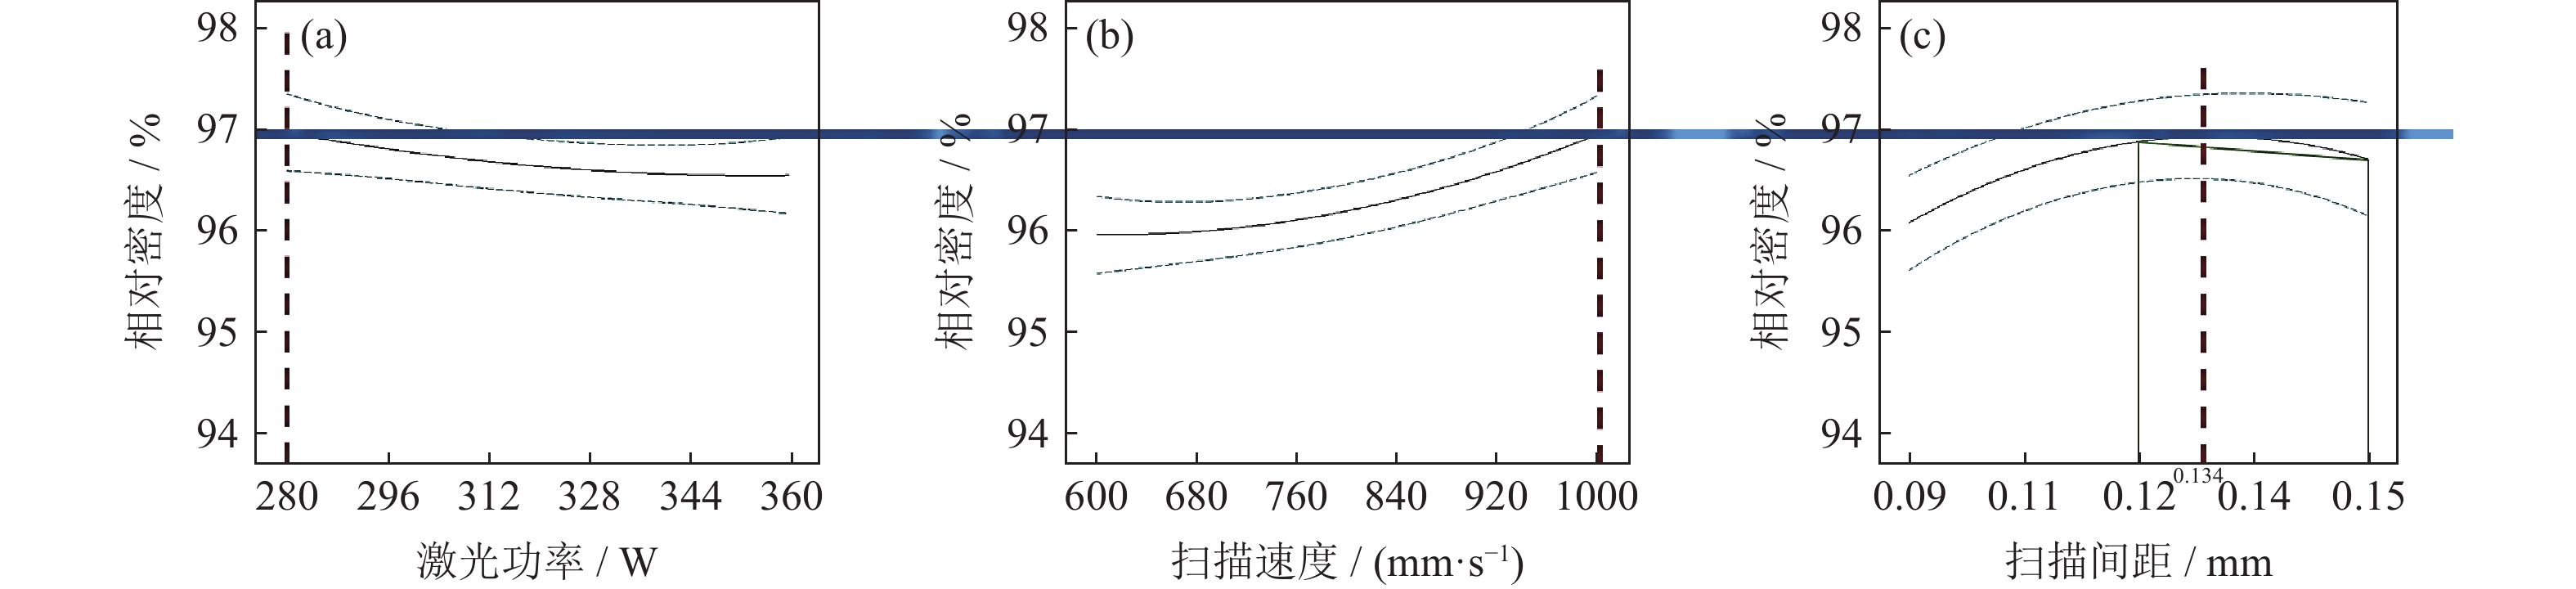
图 6 与相对密度对应的响应优化曲线图:(a)激光功率;(b)扫描速度;(c)扫描间距
Figure 6. Response optimization curve corresponding to the relative density: (a) laser power; (b) scanning speed; (c) scanning spacing
表 1 镍基粉末高温合金化学成分(质量分数)
Table 1. Chemical composition of the nickel-based powder superalloys
% Al Cr Fe Ti Y Cu Si C Ni 0.25 21.00 0.85 0.57 0.68 0.009 0.002 0.059 余量  下载: 导出CSV
表 2 田口法分析的输入参数及其水平
Table 2. Input parameters and the levels of Taguchi method
水平 激光功率 / W 扫描速度 / (mm·s−1) 扫描间距 / mm 水平1 240 600 0.09 水平2 280 800 0.12 水平3 320 1000 0.15 水平4 360 — — 水平5 400 — —
下载: 导出CSV
表 3 响应面中Box-Behnken分析的输入参数及其水平
Table 3. Input parameters and the levels of Box-Behnken analysis in response surface
水平 因素 激光功率 / W 扫描速度 / (mm·s−1) 扫描间距 / mm −1 280 600 0.09 0 320 800 0.12 1 360 1000 0.15
下载: 导出CSV
表 4 田口法实验记录的相对密度及其信噪比
Table 4. Relative density and signal-to-noise ratio recorded by Taguchi method
序号 因素 响应 激光功率 /
W扫描速度 /
(mm·s−1)扫描间距 /
mm相对密度 /
%信噪比 /
dB1 320 800 0.09 95.97 39.64 2 400 600 0.12 95.42 39.59 3 400 800 0.15 94.74 39.53 4 400 1000 0.09 95.76 39.62 5 360 1000 0.09 96.61 39.70 6 360 800 0.15 94.96 39.55 7 320 600 0.15 94.29 39.49 8 280 600 0.09 96.19 39.66 9 280 1000 0.12 96.85 39.72 10 400 600 0.09 95.38 39.59 11 240 1000 0.15 93.70 39.43 12 240 600 0.09 95.83 39.63 13 320 800 0.09 95.97 39.64 14 280 600 0.15 96.29 39.67 15 360 800 0.09 95.35 39.59 16 240 800 0.12 95.96 39.64 17 400 800 0.12 95.36 39.59 18 240 600 0.09 95.83 39.63 19 240 800 0.12 95.96 39.64 20 360 600 0.12 95.40 39.59 21 280 800 0.12 95.49 39.60 22 320 600 0.12 96.44 39.69 23 280 800 0.09 95.40 39.59 24 360 600 0.12 95.40 39.59 25 320 1000 0.12 96.54 39.69
下载: 导出CSV
表 5 相对密度的方差分析
Table 5. Variance analysis of the relative density
来源 激光功率 / W 扫描速度 / (mm·s−1) 扫描间距 / mm 残差误差 合计 自由度 4 2 2 12 20 平方和 0.017280 0.006672 0.033382 0.043051 0.100385 平方均值 0.003780 0.002618 0.016691 0.003588 — F值 1.05 0.73 4.65 — — P值 0.421 0.502 0.032 — — 贡献 / % 17.21 6.65 33.25 42.89 —
下载: 导出CSV
表 6 各因素的平均信噪比及极差范围
Table 6. Average signal-to-noise ratio and the range of each factor
dB 水平 因素 激光功率 扫描速度 扫描间距 水平1 39.57 39.61 39.63 水平2 39.65 39.59 39.64 水平3 39.63 39.64 39.54 水平4 39.61 — — 水平5 39.58 — — 极差范围 0.08 0.04 0.10 排序 2 3 1
下载: 导出CSV
表 7 基于Box-Behnken设计的响应面法工艺参数及其相对密度
Table 7. Process parameters and the relative density of RSM based on Box-Behnken design
序号 因素 相对密度 / % 激光功率 / W 扫描速度 / (mm·s−1) 扫描间距 / mm 1 360 800 0.15 94.96 2 280 600 0.12 96.13 3 320 800 0.12 95.82 4 360 600 0.12 95.40 5 320 800 0.12 95.82 6 280 800 0.09 95.40 7 320 800 0.12 95.82 8 320 800 0.12 95.82 9 320 600 0.15 94.29 10 280 1000 0.12 96.85 11 320 1000 0.09 96.06 12 360 800 0.09 95.35 13 320 1000 0.15 96.37 14 320 800 0.12 95.82 15 360 1000 0.12 96.41 16 280 800 0.15 95.89 17 320 600 0.09 95.43
下载: 导出CSV
表 8 各模型的统计信息
Table 8. Statistics for each model
类型 均方差 相关系数,R2 调整决定系数 预测决定系数 预测误差平方和 选择建议 一阶线性模型 0.44 0.5558 0.4533 0.0755 5.860 — 2FI 0.42 0.6879 0.5006 −0.5815 8.410 — 二阶模型 0.23 0.9582 0.9004 0.3311 15.588 建议
下载: 导出CSV
表 9 响应面二次模型的方差分析
Table 9. Variance analysis of response surface quadratic model
类型 平方和 自由度 均方差 F值 P值 Prob > F 模型 5.340 9 0.590 17.86 0.0005 显著 A 0.580 1 0.580 17.38 0.0042 — B 2.460 1 2.450 74.14 <0.0001 — C 0.067 1 0.065 2.00 0.1998 — AB 0.021 1 0.020 0.63 0.4525 AC 0.190 1 0.190 5.82 0.0465 — BC 0.530 1 0.530 15.81 0.0053 — A2 0.061 1 0.060 1.82 0.2189 — B2 0.280 1 0.280 8.40 0.0230 — C2 1.230 1 1.240 36.94 0.0005 — 残差 0.230 7 0.033 — — — 失拟项 0.230 3 0.078 — — — 纯误差 0 4 0 — — — 总离差 5.560 16 — — — — 标准差 0.180 — 相关系数R2 0.9583 — — 平均值 95.740 — 调整决定系数 0.9046 — — 变化系数 /
%0.190 — 预测决定系数 0.3325 — — 预测误差平方和 3.720 — 精确度 17.307 — —
下载: 导出CSV
表 10 田口法和响应面法的预测值与实验验证值
Table 10. Predicted and confirmatory values in experiment of TM and RSM
方法 因素 相对密度 / % 误差 / % 激光功率 / W 扫描速度 / (mm·s−1) 扫描间距 / mm 预测值 验证值 田口法 280 1000 0.12 96. 61 96.87 0.27 响应面法 280 1000 0.12 96.95 96.87 0.07
下载: 导出CSV
表 11 田口法预测值和验证性实验值
Table 11. Predicted and confirmatory values in experiment by TM
方法 因素 相对密度 / % 激光功率 / W 扫描速度 / (mm·s−1) 扫描间距 / mm 测量值 预测值 CI值及其范围 差值百分数 / % 田口法 280 1000 0.12 96.87 96.61 ±4.24[92.37, 100.85] 0.26 240 1000 0.15 93.98 94.95 ±4.24[90.71, 99.19] 0.97
下载: 导出CSV
-
[1] Kempen K, Thijs L, Van Humbeeck J, et al. Mechanical properties of AlSi10Mg produced by selective laser melting. Physics Procedia, 2012, 39: 439 doi: 10.1016/j.phpro.2012.10.059 [2] Kempen K, Yasa E, Thijs L, et al. Microstructure and mechanical properties of selective laser melted 18Ni–300 steel. Physics Procedia, 2011, 12: 255 doi: 10.1016/j.phpro.2011.03.033 [3] Zhang D, Wang W, Guo Y, et al. Numerical simulation in the absorption behavior of Ti6Al4V powder materials to laser energy during SLM. J Mater Process Technol, 2019, 268: 25 doi: 10.1016/j.jmatprotec.2019.01.002 [4] Wang M, Song B, Wei Q, et al. Effects of annealing on the microstructure and mechanical properties of selective laser melted AlSi7Mg alloy. Mater Sci Eng A, 2019, 739: 463 doi: 10.1016/j.msea.2018.10.047 [5] Mo Y, Wang D Z, Du L, et al. Development overview of nickel base superalloy powder for additive manufacturing // 2018 China (International) High Level Forum on Functional Materials Technology and Industry Proceedings. Tianjin, 2018: 10莫燕, 王东哲, 杜琳, 等. 增材制造用镍基超合金粉末发展概述//2018中国(国际)功能材料科技与产业高层论坛论文集. 天津, 2018: 10 [6] Tang Z J, Guo T M, Fu Y, et al. Research present situation and the development prospect of nickel-based superalloy. Met World, 2014(1): 36唐中杰, 郭铁明, 付迎, 等. 镍基高温合金的研究现状与发展前景. 金属世界, 2014(1): 36 [7] Mishra A K, Kumar A. Numerical and experimental analysis of the effect of volumetric energy absorption in powder layer on thermal-fluidic transport in selective laser melting of Ti6Al4V. Opt Laser Technol, 2019, 111: 227 doi: 10.1016/j.optlastec.2018.09.054 [8] Jia Q, Gu D. Selective laser melting additive manufacturing of Inconel 718 superalloy parts: Densification, microstructure and properties. J Alloys Compd, 2014, 585: 713 doi: 10.1016/j.jallcom.2013.09.171 [9] Wang D, Wu S, Yang Y, et al. The Effect of a scanning strategy on the residual stress of 316L steel parts fabricated by selective laser melting (SLM). Materials, 2018, 11(10): 1821 doi: 10.3390/ma11101821 [10] Bao X F, Xie Y X, Wang H H. Improvement on the pickling process of capacitor-grade niobium powder by DOE experimental design method. Powder Metall Technol, 2017, 35(5): 371包玺芳, 解永旭, 王晖晖. 采用DOE实验设计方法改进电容器级铌粉酸洗工艺. 粉末冶金技术, 2017, 35(5): 371 [11] Sun J, Yang Y, Wang D. Parametric optimization of selective laser melting for forming Ti6Al4V samples by Taguchi method. Opt Laser Technol, 2013, 49: 118 doi: 10.1016/j.optlastec.2012.12.002 [12] Read N, Wang W, Essa K, et al. Selective laser melting of AlSi10Mg alloy: Process optimisation and mechanical properties development. Mater Des, 2015, 65: 417 doi: 10.1016/j.matdes.2014.09.044 [13] Aghdeab H S, Mohammed L A, Ubaid A M. Optimization of CNC turning for aluminum alloy using simulated annealing method. Jordan J Mech Ind Eng, 2015, 9(1): 39 [14] Zhang Z Z, Han C L, Li C W. Application of response surface method in experimental design and optimization. Henan Inst Educ Nat Sci, 2011, 20(4): 34张泽志, 韩春亮, 李成未. 响应面法在试验设计与优化中的应用. 河南教育学院学报(自然科学版), 2011, 20(4): 34 [15] Zeng F Z, Zhao X. Taguchi method and its standardized design. Mach Ind Stand Qual, 2003(11): 7曾凤章, 赵霞. 田口方法及其标准化设计. 机械工业标准化与质量, 2003(11): 7 [16] Dongxia Y, Xiaoyan L, Dingyong H, et al. Optimization of weld bead geometry in laser welding with filler wire process using Taguchi's approach. Opt Laser Technol, 2012, 44(7): 2020 doi: 10.1016/j.optlastec.2012.03.033 [17] Ghani J A, Choudhury I A, Hassan H H. Application of Taguchi method in the optimization of end milling parameters. J Mater Process Technol, 2004, 145(1): 84 doi: 10.1016/S0924-0136(03)00865-3 [18] Li L, Zhang S, He Q, et al. Application of response surface methodology in experiment design and optimization. Res Explor Lab, 2015, 34(8): 41李莉, 张赛, 何强, 等. 响应面法在试验设计与优化中的应用. 实验室研究与探索, 2015, 34(8): 41 [19] Yolmeh M, Jafari S M. Applications of response surface methodology in the food industry processes. Food Bioprocess Technol, 2017, 10(3): 413 doi: 10.1007/s11947-016-1855-2 [20] Ghorbannezhad P, Bay A, Yolmeh M, et al. Optimization of coagulation-flocculation process for medium density fiberboard (MDF) wastewater through response surface methodology. Desalin Water Treat, 2016, 57(56): 26916 doi: 10.1080/19443994.2016.1170636 [21] Stephens J J, Nix W D. The effect of grain morphology on longitudinal creep properties of INCONEL MA 754 at elevated temperatures. Metall Mater Trans A, 1985, 16(7): 1307 doi: 10.1007/BF02670335 [22] Meng Z J, Wang Y, Niu L J, et al. Optimization of permanent mold casting processes for shrinkage porosity reduction in Cu–45Ag alloy by simulation and Taguchi method. Spec Cast Nonferrous Alloys, 2018, 38(10): 1064孟志军, 王晔, 牛连杰, 等. 基于田口方法的Cu–45Ag合金金属型铸造过程仿真及工艺优化. 特种铸造及有色合金, 2018, 38(10): 1064 -


 点击查看大图
计量
- 文章访问数: 498
- HTML全文浏览量: 141
- PDF下载量: 42
- 被引次数: 0
